[Day 10] Supervised Machine Learning Type 1 - Linear Regression (with a Small Python Project)
Want to predict house prices or Canada’s future income? Linear Regression is your go-to tool—simple, powerful, and perfect for real-world insights.
![[Day 10] Supervised Machine Learning Type 1 - Linear Regression (with a Small Python Project)](https://storage.ghost.io/c/55/e8/55e827ca-bf8d-4eee-bdb4-ee48e49a011a/content/images/size/w2000/2025/03/_--visual-selection--9-.svg)
Understanding Linear Regression in Machine Learning
Linear Regression is a widely used supervised learning algorithm for predicting continuous values. It is simple, and interpretable, and helps to establish a relationship between the input features and the target variable using a straight line. The key idea is to find the best-fitting line that minimizes the error between the predicted and actual values.
In regression tasks, Linear Regression predicts continuous values, like estimating the price of a house, predicting sales, or forecasting the temperature.
What makes Linear Regression special is its simplicity and ability to explain how the input features are related to the target variable.
How Does Linear Regression Work?
- Fitting the Line (Linear Relationship):Linear regression works by fitting a straight line (in two dimensions) or a hyperplane (in higher dimensions) that best represents the relationship between the input features and the target variable.
- Calculating the Best Fit:The model tries to find the line that minimizes the difference between the predicted values and the actual values. This is achieved by using a method called Least Squares, which calculates the line that minimizes the sum of the squared differences (errors).
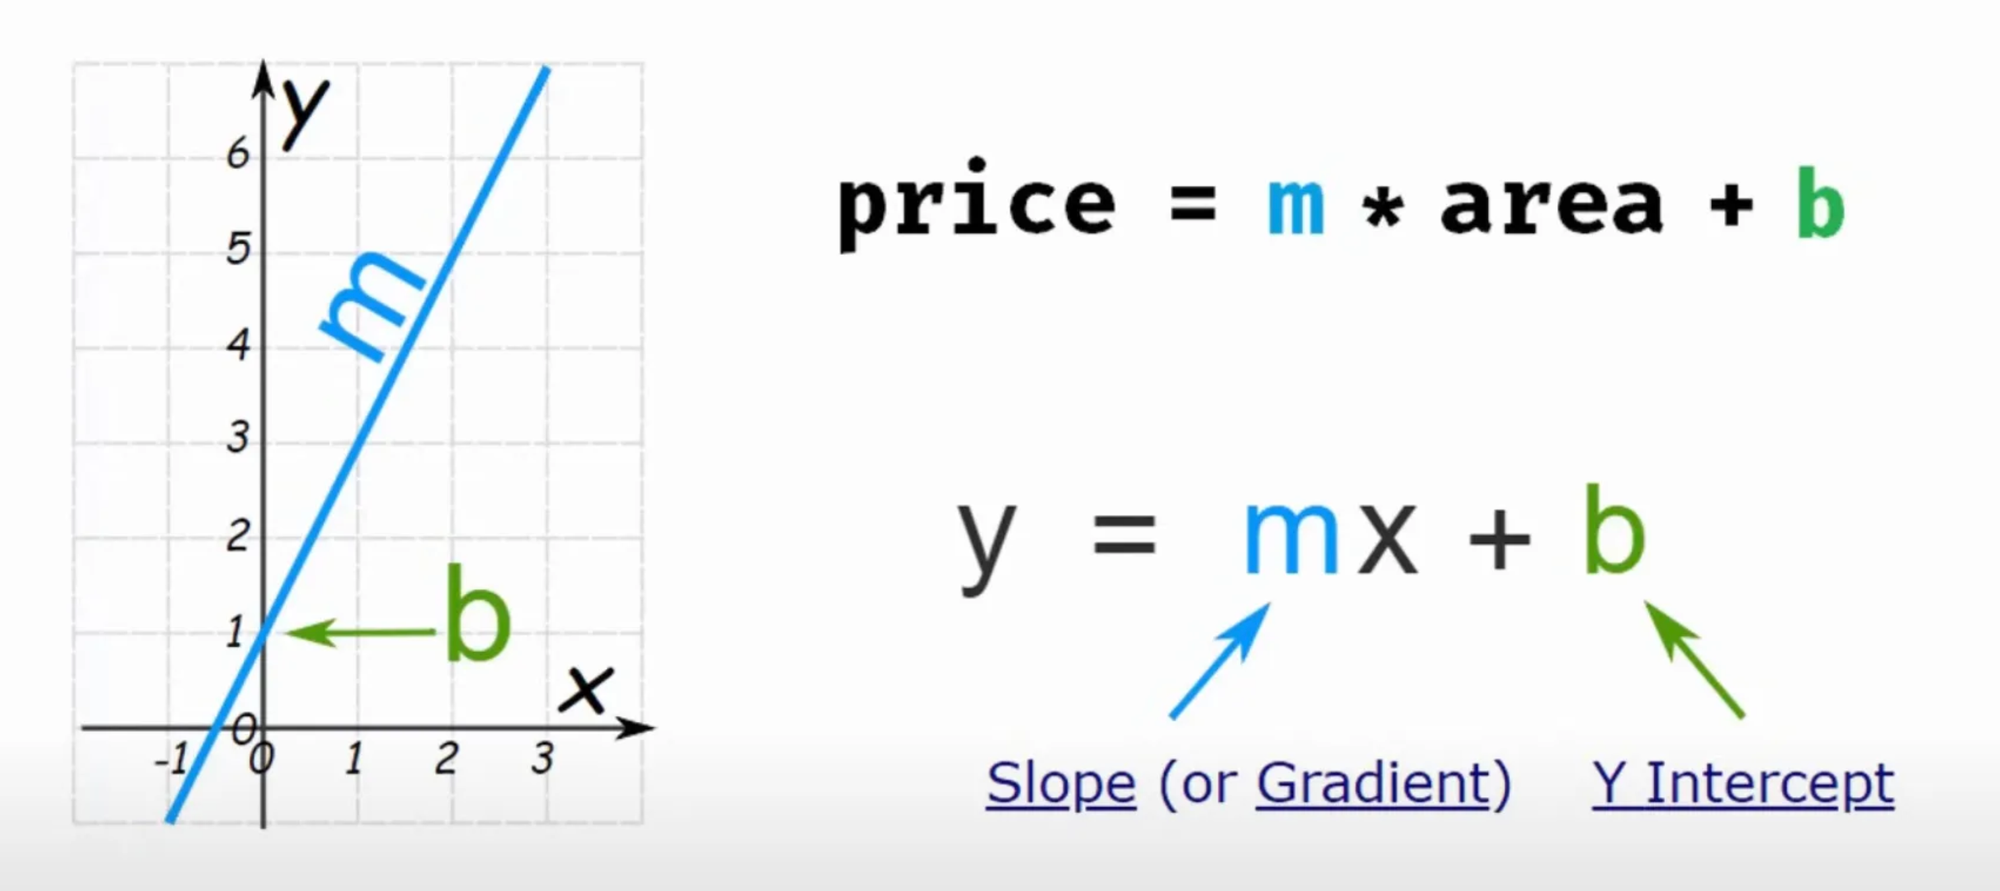
Prediction:Once the model is trained, it can predict the output for new data based on the learned relationship. The line equation is used to make predictions.Equation for Simple Linear Regression:For a single feature, the equation is:
y = mx + c
Where:
- y is the predicted output (target variable).
- x is the input feature.
- m is the intercept (where the line crosses the y-axis).
- c is the weight (slope) of the input feature.
[Must Watch] Suggested videos for better understanding:
Example: Predicting House Prices
Let’s say you want to predict the price of a house based on its size. You collect data on house sizes and their corresponding prices. Linear regression will try to find the best line that fits the data to predict the price of a house based on its size.
Here’s how the data might look:
| Size (sq ft) | Price ($) |
|---|---|
| 800 | 150,000 |
| 1,000 | 200,000 |
| 1,200 | 250,000 |
| 1,500 | 300,000 |
| 1,800 | 350,000 |
A linear regression model will find a straight line that best represents the relationship between the house size and the price.
Why Use Linear Regression?
- Simplicity:Linear Regression is easy to understand and implement. It provides a straightforward relationship between the input features and the target variable.
- Interpretable:The model's predictions are easy to interpret. You can see how much each feature (e.g., house size) impacts the target variable (e.g., house price).
- Efficient:Linear Regression is computationally efficient, making it suitable for large datasets.
Limitations of Linear Regression
- Linearity Assumption:Linear Regression assumes a straight-line relationship between the input features and the target variable. If the data has a more complex, non-linear relationship, this method may not perform well.
- Outliers:Linear Regression is sensitive to outliers. A few extreme values can significantly affect the model’s predictions.
- Multicollinearity:If two or more features are highly correlated, it can lead to instability in the model and affect the accuracy of predictions.
the
Predicting House Prices
Use case: Predicting Canada's Per Capita Income
A colleague has requested your assistance in forecasting Canada's Per Capita Income for the next few years to support strategic planning and decision-making. Historical data on Per Capita Income and corresponding years is available as a reference. The goal is to analyze this data and develop a predictive model that estimates future income trends based on historical patterns.
Data set:
| year | PCI |
|---|---|
| 1970 | 3399.29904 |
| 1971 | 3768.29794 |
| 1972 | 4251.17548 |
| 1973 | 4804.46325 |
| 1974 | 5576.51458 |
| 1975 | 5998.14435 |
| 1976 | 7062.13139 |
| 1977 | 7100.12617 |
| 1978 | 7247.96704 |
| 1979 | 7602.91268 |
| 1980 | 8355.96812 |
| 1981 | 9434.39065 |
| 1982 | 9619.43838 |
| 1983 | 10416.5366 |
| 1984 | 10790.3287 |
| 1985 | 11018.9559 |
| 1986 | 11482.8915 |
| 1987 | 12974.8066 |
| 1988 | 15080.2835 |
| 1989 | 16426.7255 |
| 1990 | 16838.6732 |
| 1991 | 17266.0977 |
| 1992 | 16412.0831 |
| 1993 | 15875.5867 |
| 1994 | 15755.8203 |
| 1995 | 16369.3173 |
| 1996 | 16699.8267 |
| 1997 | 17310.7578 |
| 1998 | 16622.6719 |
| 1999 | 17581.0241 |
| 2000 | 18987.3824 |
| 2001 | 18601.3972 |
| 2002 | 19232.1756 |
| 2003 | 22739.4263 |
| 2004 | 25719.1472 |
| 2005 | 29198.0557 |
| 2006 | 32738.2629 |
| 2007 | 36144.4812 |
| 2008 | 37446.4861 |
| 2009 | 32755.1768 |
| 2010 | 38420.5229 |
| 2011 | 42334.7112 |
| 2012 | 42665.256 |
| 2013 | 42676.4684 |
| 2014 | 41039.8936 |
| 2015 | 35175.189 |
| 2016 | 34229.1936 |
Save this data as canada_data.csv
Objective: To predict the PCI of other years based after training the model on given data.
Solution: We will use linear regression to train and predict.
I am using jupyter to write the code:
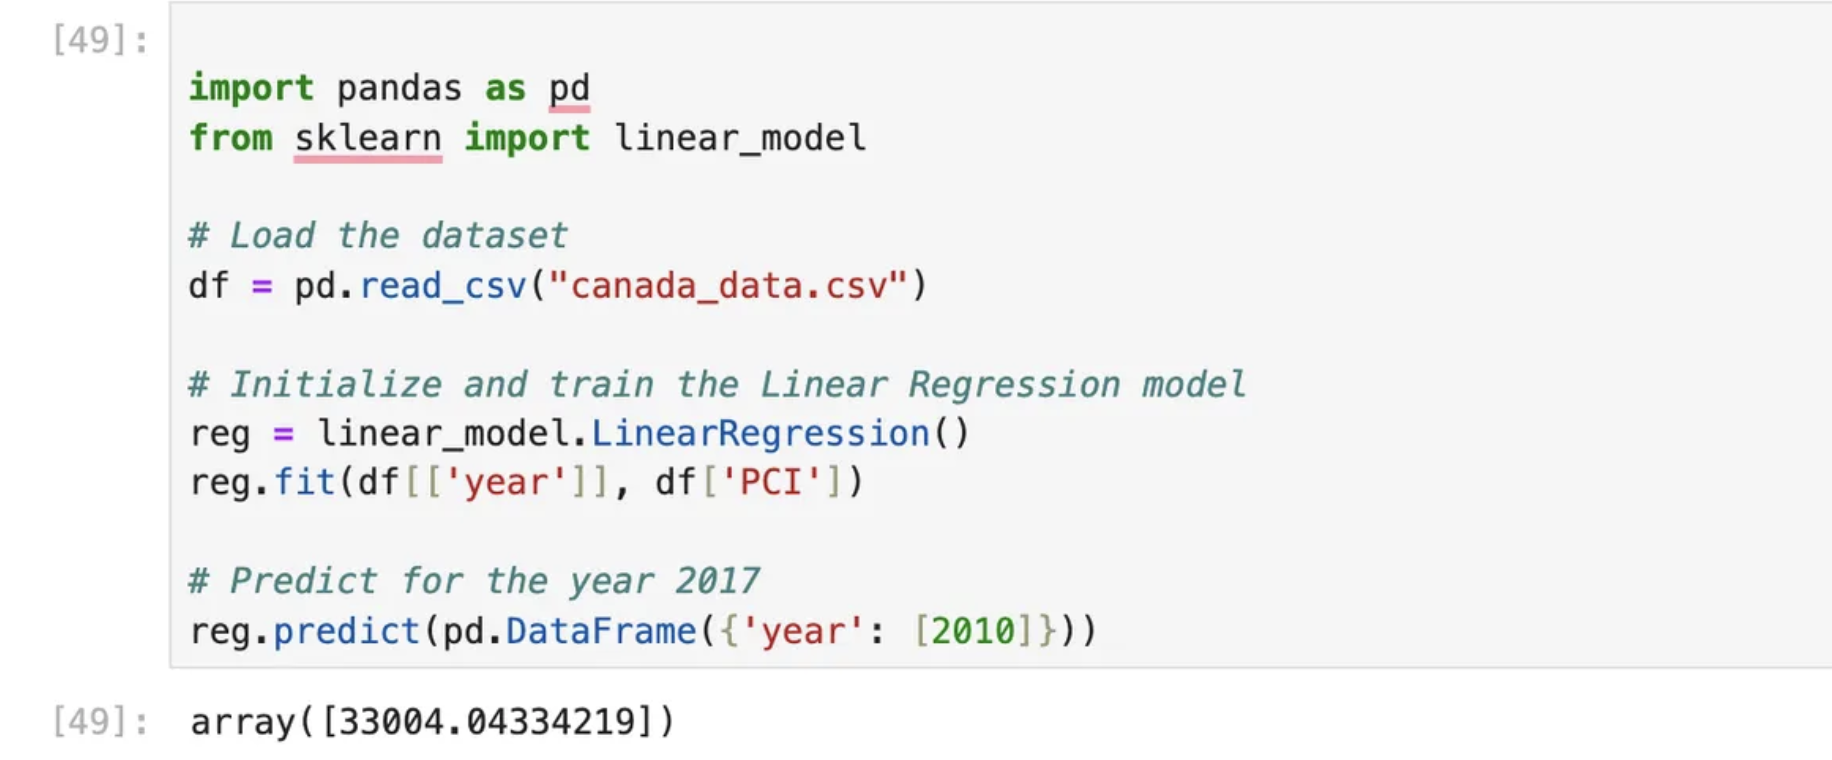
import pandas as pd
from sklearn import linear_model
# Load the dataset
df = pd.read_csv("canada_data.csv")
# Initialize and train the Linear Regression model
reg = linear_model.LinearRegression()
reg.fit(df[['year']], df['PCI'])
# Predict for the year 2017
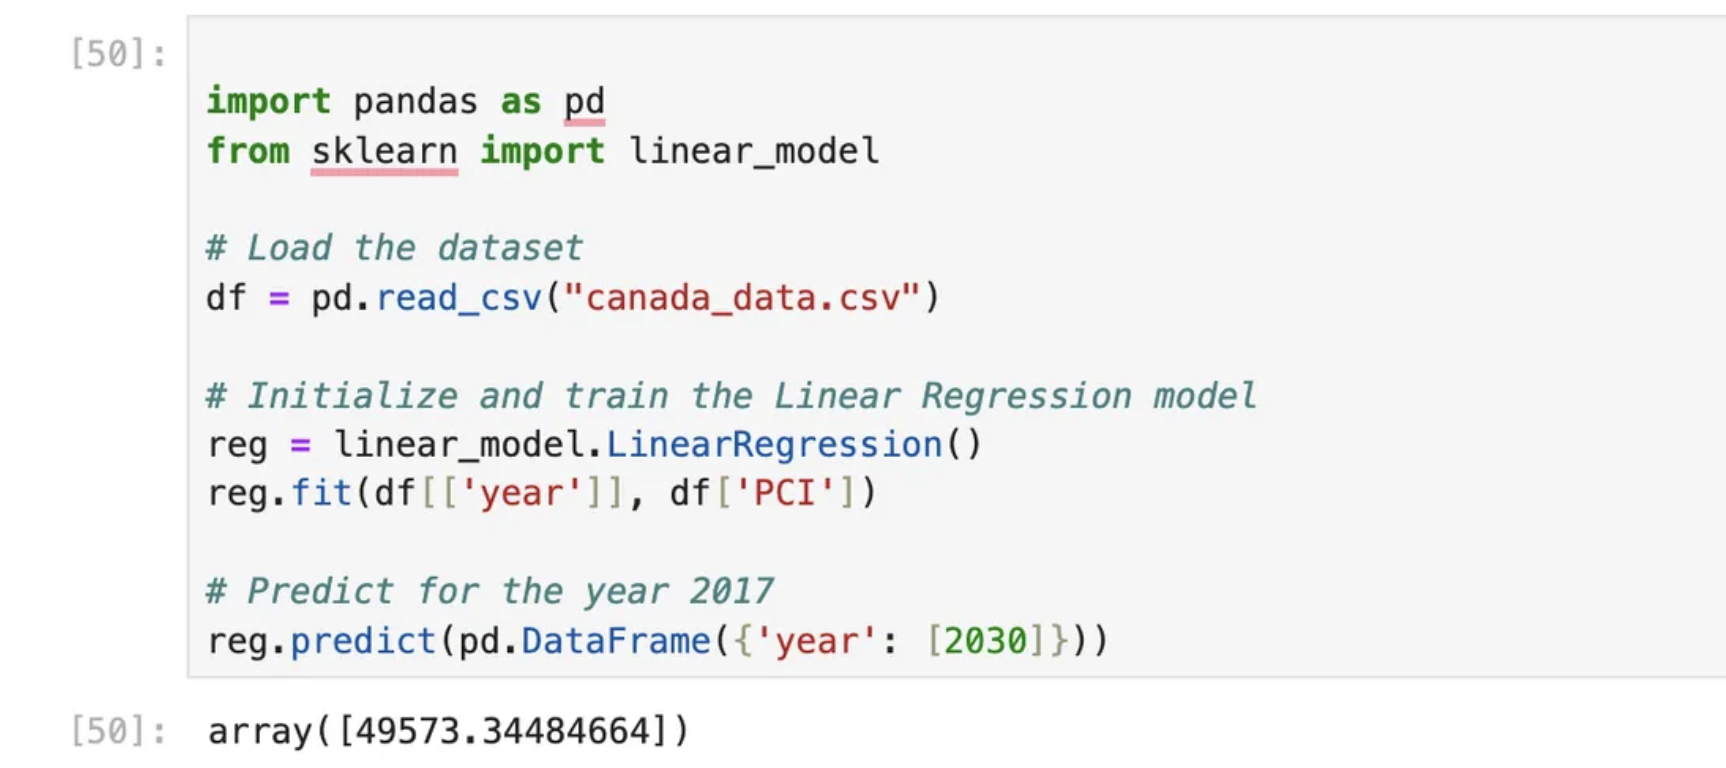
reg.predict(pd.DataFrame({'year': [2030]}))Predictions:
- Input: 2020
Output: 33004
- Input: 2030
Output: 49573
Code explained here:
1. Import Libraries:
import pandas as pd
from sklearn import linear_model
pandas(pd): A powerful library used for data manipulation and analysis. It is often used for handling structured data like CSV files, DataFrames, etc.linear_modelfromsklearn: This imports the linear regression model class from thescikit-learnlibrary, which is used to create and train linear regression models.
2. Load the Dataset:
df = pd.read_csv("canada_data.csv")
- This line reads the dataset stored in a file called
"canada_data.csv"into apandas.DataFrame(nameddf). - The
read_csvfunction assumes the file is in CSV format, and it loads the data into a DataFrame, which allows you to easily manipulate and analyze the data.Assumed Structure of Data (df):dfis a DataFrame where we expect at least two columns:'year': Represents the year.'PCI': Represents the Per Capita Income (PCI) for Canada in that particular year.
3. Initialize and Train the Linear Regression Model:
reg = linear_model.LinearRegression()
reg.fit(df[['year']], df['PCI'])
reg = linear_model.LinearRegression(): This creates an instance of theLinearRegressionmodel and assigns it to the variablereg.LinearRegressionis a class fromscikit-learnthat fits a linear regression model to data. The model learns the relationship between the input features (independent variables) and the target variable (dependent variable).
reg.fit(df[['year']], df['PCI']): This trains (fits) the linear regression model using the dataset.df[['year']]: This selects theyearcolumn as the input feature. Notice that it’s inside double square brackets ([['year']]), which is used to select the column as a DataFrame (not a Series).df['PCI']: This selects thePCIcolumn as the target variable (dependent variable). The model will learn howPCIdepends onyear.
4. Making Predictions:
reg.predict(pd.DataFrame({'year': [2010]}))
- This makes a prediction using the trained model (
reg) for a given year (2010 in this case). pd.DataFrame({'year': [2010]}): Creates a newpandas.DataFramewith one row and one column ('year'), where the year is set to 2010.- This DataFrame will be the input for the prediction.
reg.predict(): This uses the trained model to make a prediction based on the provided input data (in this case, the year 2010). Thepredictfunction will output the estimated PCI for the given year based on the learned linear relationship.
Real-life use cases:
Here are the top 5 real-life use cases of Linear Regression:
- House Price Prediction: Estimating property prices based on features like area, number of rooms, location, and amenities.
- Stock Market Forecasting: Predicting stock prices using historical data and market trends.
- Sales Forecasting: Estimating future sales based on past sales data, marketing spend, and seasonality.
- Healthcare Cost Estimation: Predicting medical treatment costs based on patient history, demographics, and illness severity.
- Demand-Supply Analysis: Predicting product demand in supply chain management to optimize inventory levels.
Each of these applications drives critical decisions across industries!
Nutshell:
Linear Regression is a simple and effective method for predicting continuous values based on linear relationships. It's widely used in various fields, from predicting house prices to sales forecasting. While it’s easy to implement and interpret, it works best when the relationship between the features and the target is linear. For more complex relationships, you might need more advanced techniques, but Linear Regression is a great starting point for many problems.
💬 Join the DecodeAI WhatsApp Channel for regular AI updates → Click here