[Day 12] Supervised Machine Learning Type 3 - Decision Tree (with a Small Python Project)
Ever wondered how machines decide “yes” or “no”? Dive into Decision Trees—learn with real examples, Python code & even build a music recommender!
![[Day 12] Supervised Machine Learning Type 3 - Decision Tree (with a Small Python Project)](https://storage.ghost.io/c/55/e8/55e827ca-bf8d-4eee-bdb4-ee48e49a011a/content/images/size/w2000/2025/03/_--visual-selection--17-.svg)
Understanding Decision Trees in Machine Learning
A Decision Tree is a popular and easy-to-understand tool used in machine learning for making predictions. It works by splitting data into smaller, manageable groups based on specific features, creating a tree-like structure. Each decision point (node) in the tree represents a question or condition, and at the end of each branch (leaf), the tree gives its final prediction.
In classification tasks, Decision Trees categorize data points into specific groups (e.g., "spam" or "not spam"). In regression tasks, they predict continuous values (e.g., predicting house prices) by dividing the data into intervals.
Ex-
What makes Decision Trees special is that they can handle complex rules while remaining easy to understand and visualize.
How Does a Decision Tree Work?
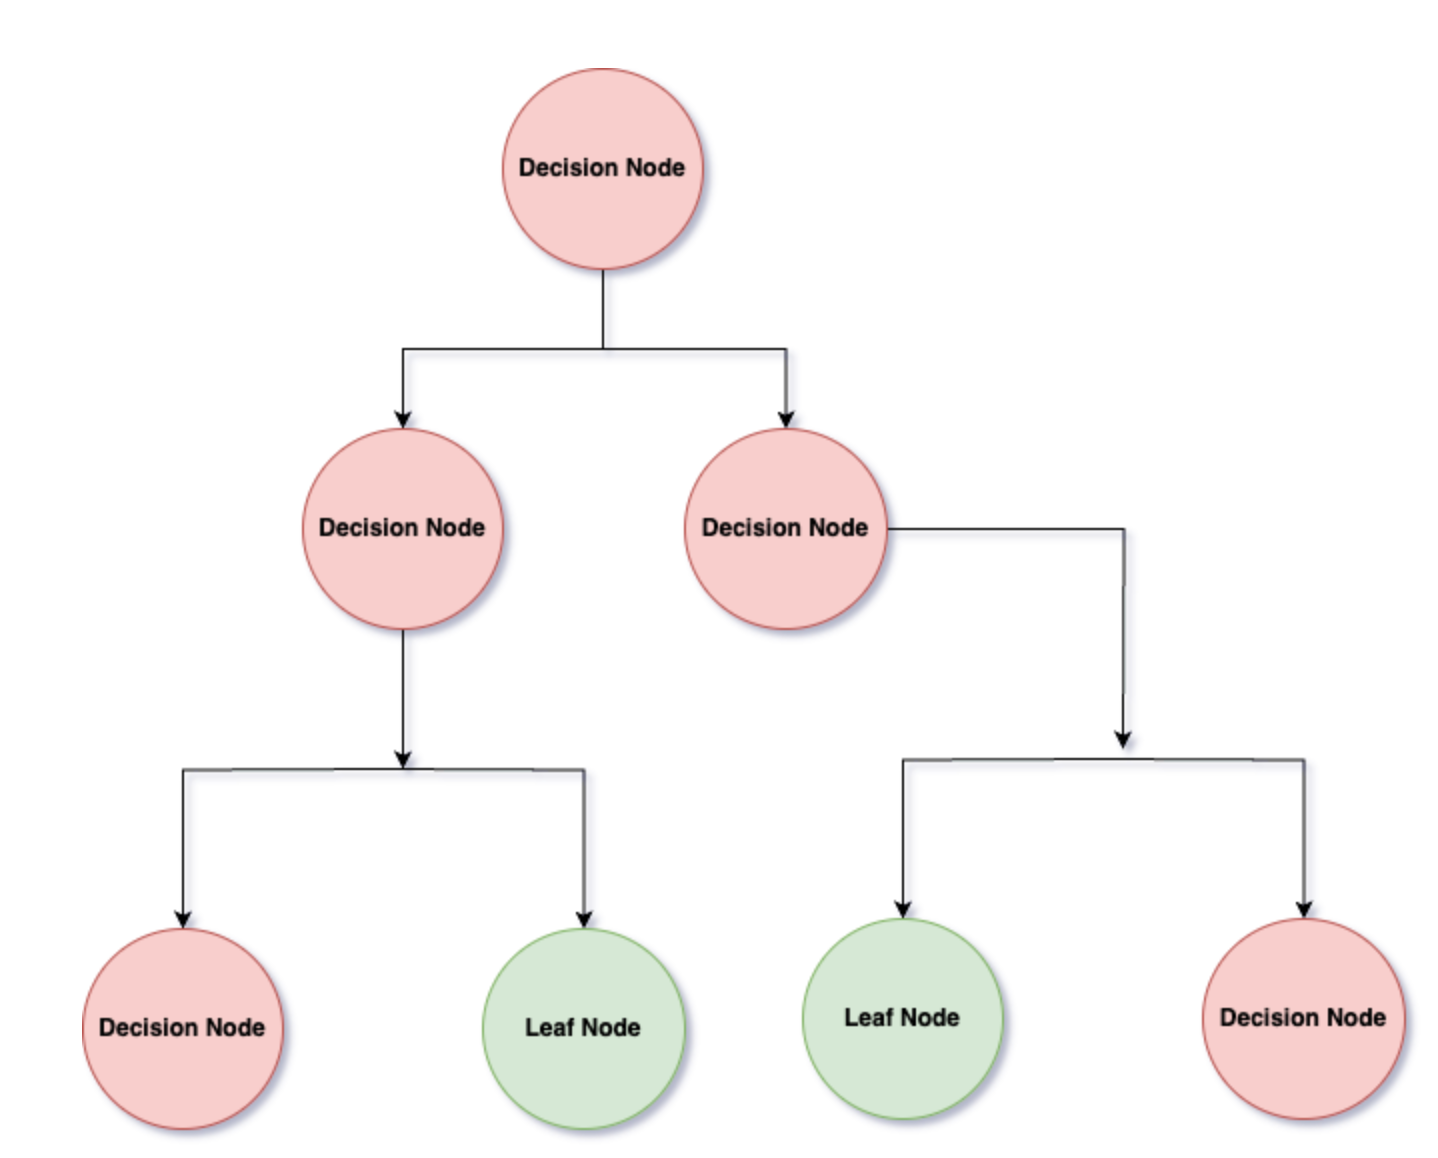
- Splitting the Data:The Decision Tree algorithm starts by asking a question about one feature (e.g., "Is the customer's age less than 30?"). It splits the data based on the answers, creating branches in the tree.
- Continuing the Process:Each branch then asks another question about a different feature (e.g., "Is income greater than $50,000?"). The process repeats, with the tree continuing to split until a final prediction is made.
- Ending with a Prediction:Once the tree finishes splitting the data, it arrives at a leaf node, which gives the final prediction. For example, the leaf might say "Yes, the customer will buy the product" or "No, they won’t buy."
Key Metrics for Splitting a Decision Tree
- Gini ImpurityGini Impurity measures how mixed the data is at each decision point. A low Gini Impurity means the data is mostly from one class (good for making a clear decision), while a high Gini Impurity means the data is more mixed. The goal is to minimize the impurity, making the splits as clear as possible.
Example: If a decision point has 80% "Yes" and 20% "No," the Gini Impurity is low. But if it’s 50% "Yes" and 50% "No," the impurity is high. - Information GainInformation Gain measures how much a feature helps in splitting the data. It calculates how much more confident the model becomes after splitting the data. A feature that leads to a big drop in uncertainty has high Information Gain.
Recommended Video:
Example: Predicting Product Purchases
Let’s say you want to predict whether a customer will buy a product based on features like age, income, and marital status. The Decision Tree might split the data like this:
- Root Question: "Is age less than 30?"
- If yes, check the next question: "Is income > $50,000?"
- If no, check another rule: "Is marital status married?"
The tree keeps asking questions based on the features until it reaches a leaf node that predicts whether the customer will buy the product.
Let's take one more example:
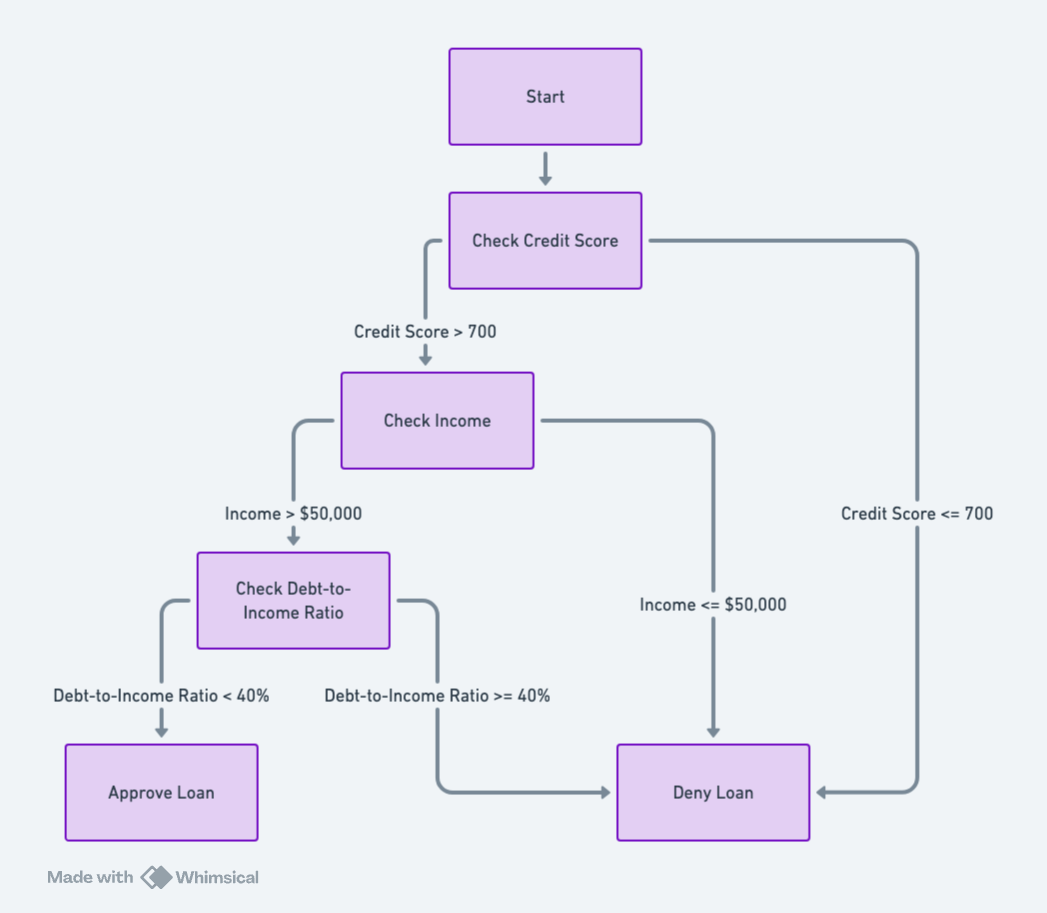
The example will be a "Loan Approval" decision tree based on inputs like credit score, income, and debt-to-income ratio.
Flowchart Logic
- Start
- Check credit score:
- If above 700, proceed to income check.
- If below 700, deny the loan.
- Check income:
- If income is above $50,000, proceed to debt-to-income ratio check.
- If below $50,000, deny the loan.
- Check debt-to-income ratio:
- If below 40%, approve the loan.
- If above 40%, deny the loan.
Why Use Decision Trees?
- Easy to Understand:Decision Trees are simple to interpret and explain. You can visualize the tree and follow the decision process step by step, making it easy to explain to others.
- Handles Different Types of Data:They work with both numerical data (like age and income) and categorical data (like marital status), making them versatile.
- Captures Complex Relationships:Unlike simple models, Decision Trees can handle complex, non-linear relationships between features and the target. This makes them suitable for many different types of problems.
Limitations of Decision Trees
- Overfitting: Decision Trees can become too detailed and fit the training data too closely, which makes them poor at predicting new data. This is called overfitting.
- Instability: Small changes in the data can lead to completely different tree structures, making the model unstable. This can be addressed by using methods like Random Forests.
- Bias Toward Features with More Levels:Decision Trees can sometimes favor features that have more categories (e.g., a feature with many unique values). This can be mitigated with proper tuning.
Quick Python Project
You are building a music recommendation feature for an app to predict the type of music users might prefer based on their age and gender. This example illustrates how to utilize a Decision Tree algorithm to analyze user attributes (e.g., age, gender) and predict their preferred music genre.
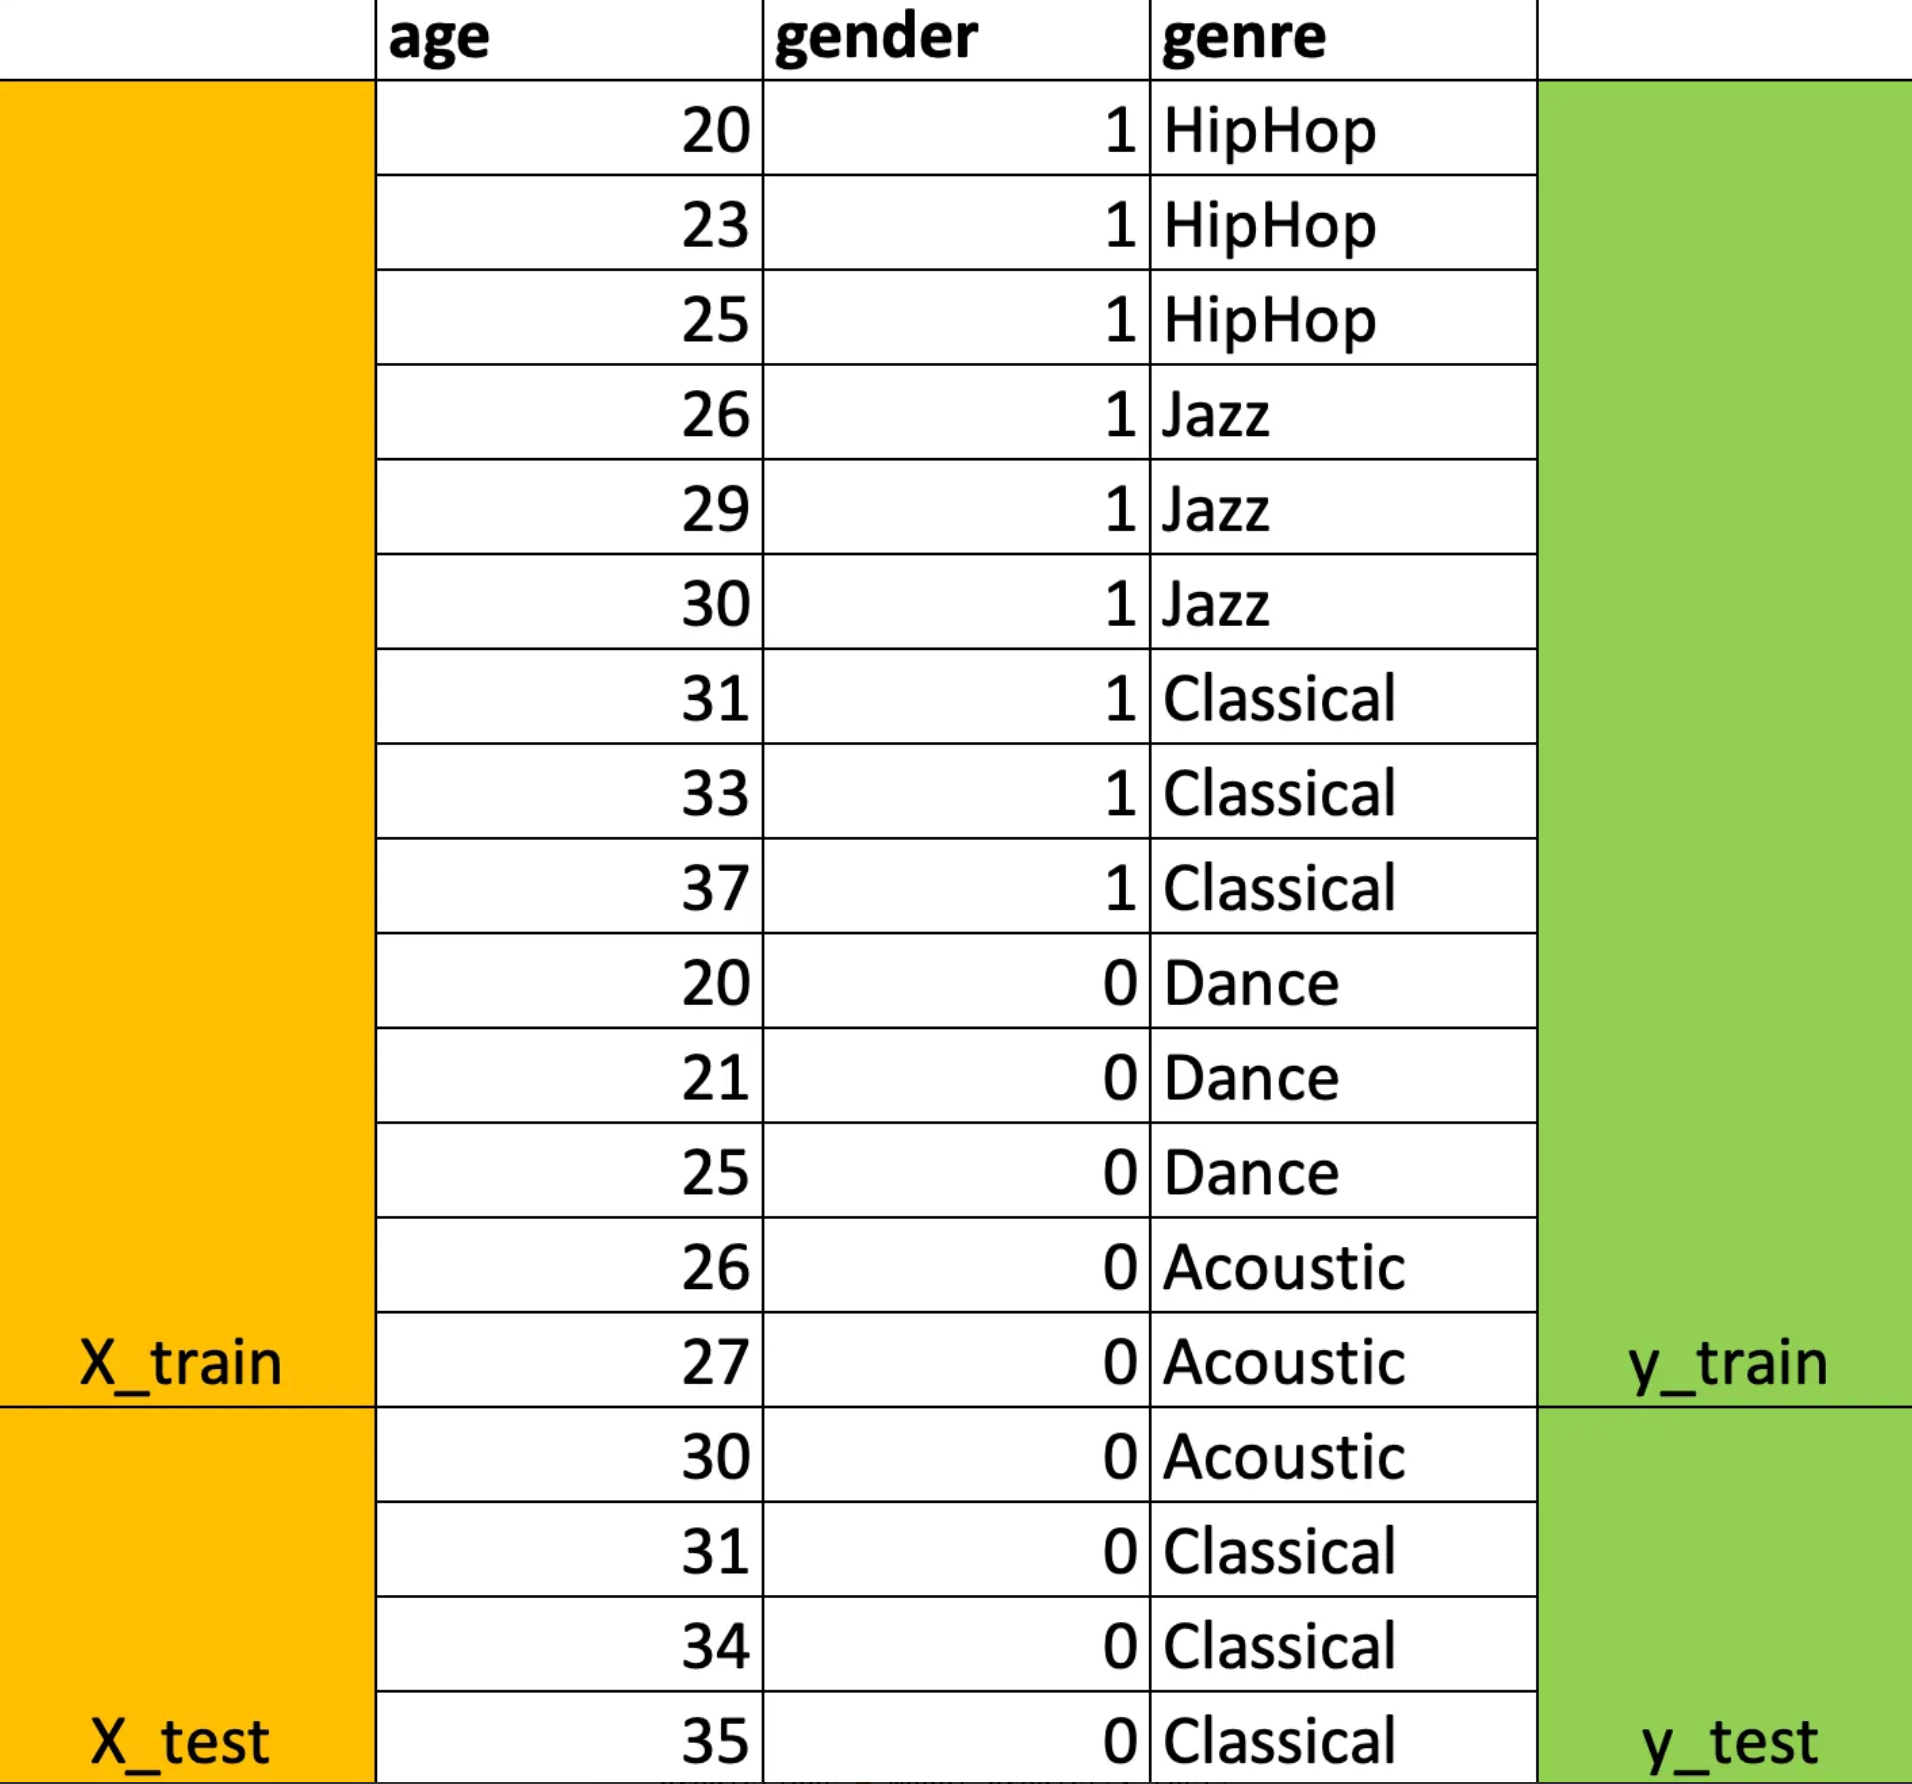
Data:
| age | gender | genre |
|---|---|---|
| 20 | 1 | HipHop |
| 23 | 1 | HipHop |
| 25 | 1 | HipHop |
| 26 | 1 | Jazz |
| 29 | 1 | Jazz |
| 30 | 1 | Jazz |
| 31 | 1 | Classical |
| 33 | 1 | Classical |
| 37 | 1 | Classical |
| 20 | 0 | Dance |
| 21 | 0 | Dance |
| 25 | 0 | Dance |
| 26 | 0 | Acoustic |
| 27 | 0 | Acoustic |
| 30 | 0 | Acoustic |
| 31 | 0 | Classical |
| 34 | 0 | Classical |
| 35 | 0 | Classical |
Solution:
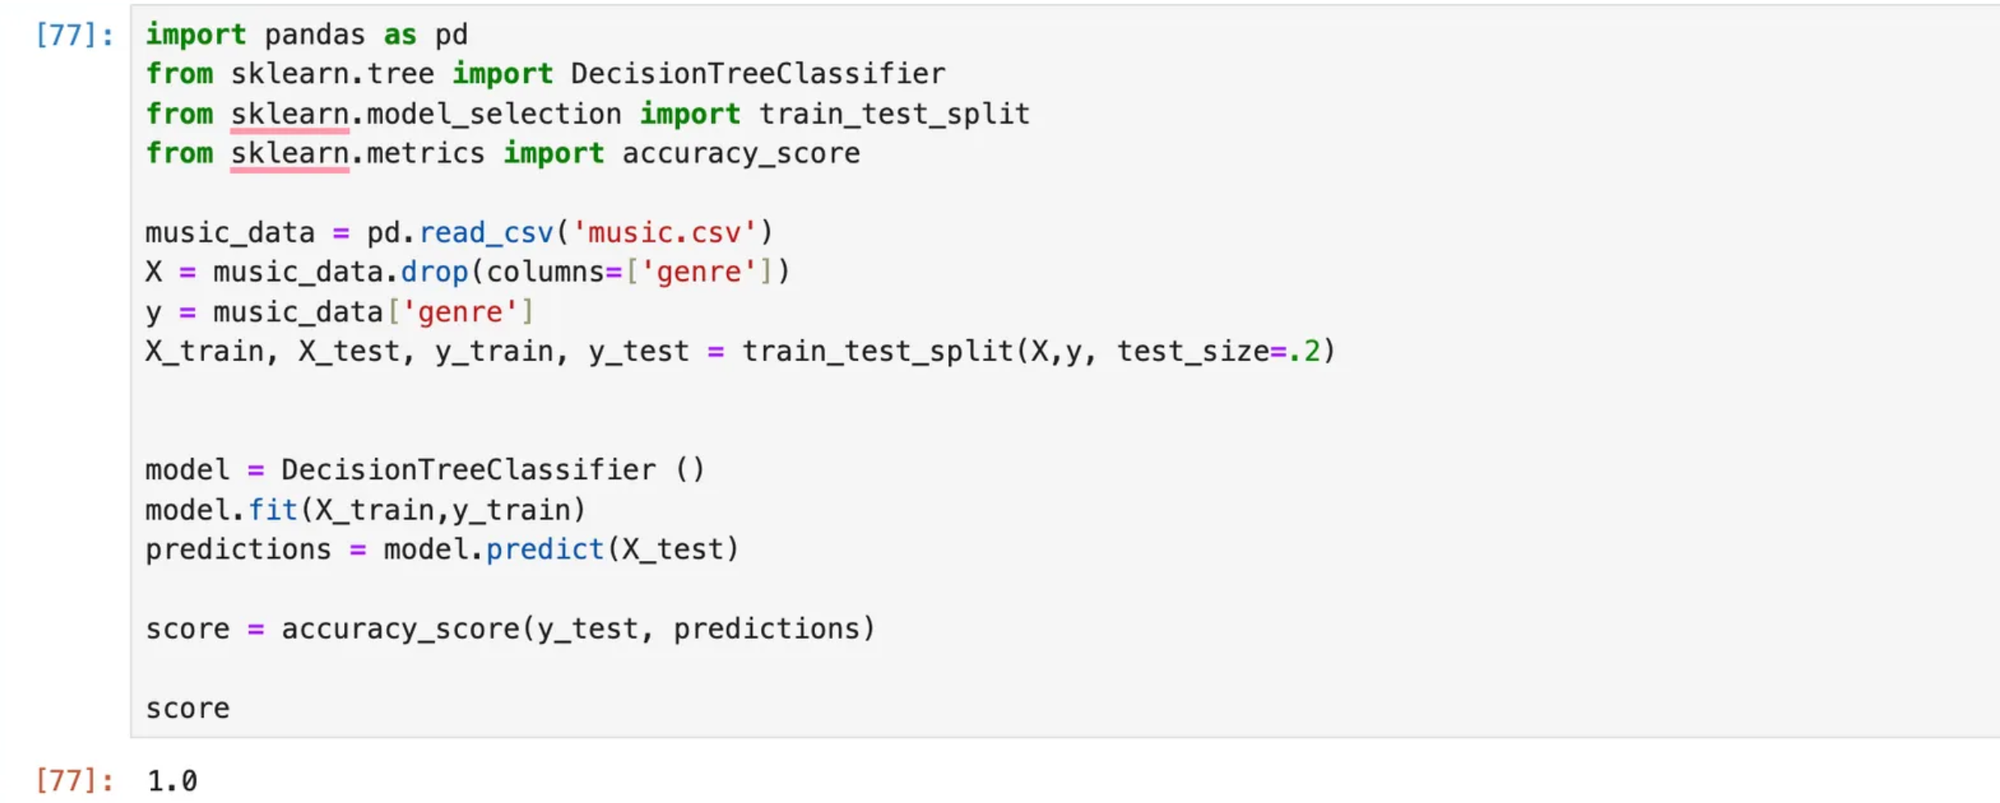
Python Code: I used Jupiter Notebook to write the code.
Checking Model Accuracy:
Here we have taken 80% of the data for training the model and 20% for testing the model. You can see the accuracy score is 100%. (As the data set is very small :))
Note: Use this dataset as music.csv
import pandas as pd
from sklearn.tree import DecisionTreeClassifier
from sklearn.model_selection import train_test_split
from sklearn.metrics import accuracy_score`

music_data = pd.read_csv('music.csv')
X = music_data.drop(columns=['genre'])
y = music_data['genre']
X_train, X_test, y_train, y_test = train_test_split(X,y, test_size=.2)`

model = DecisionTreeClassifier ()
model.fit(X_train,y_train)
predictions = model.predict(X_test)`

score = accuracy_score(y_test, predictions)`

score
Model Accurarcy is 1 i.e. 100%
Great, Let's see the code for Prediction:
import pandas as pd
from sklearn.tree import DecisionTreeClassifier
from sklearn.model_selection import train_test_split

music_data = pd.read_csv('music.csv')
X = music_data.drop(columns=['genre'])
y = music_data['genre']
train_test_split(X,y, test_size=.2)

model = DecisionTreeClassifier ()
model.fit(X.values,y)
predictions = model.predict([[32,1]])

predictions
Output [Prediction]:
- Input = 21,
Expected Output: HipHop
Actual Output: HipHop
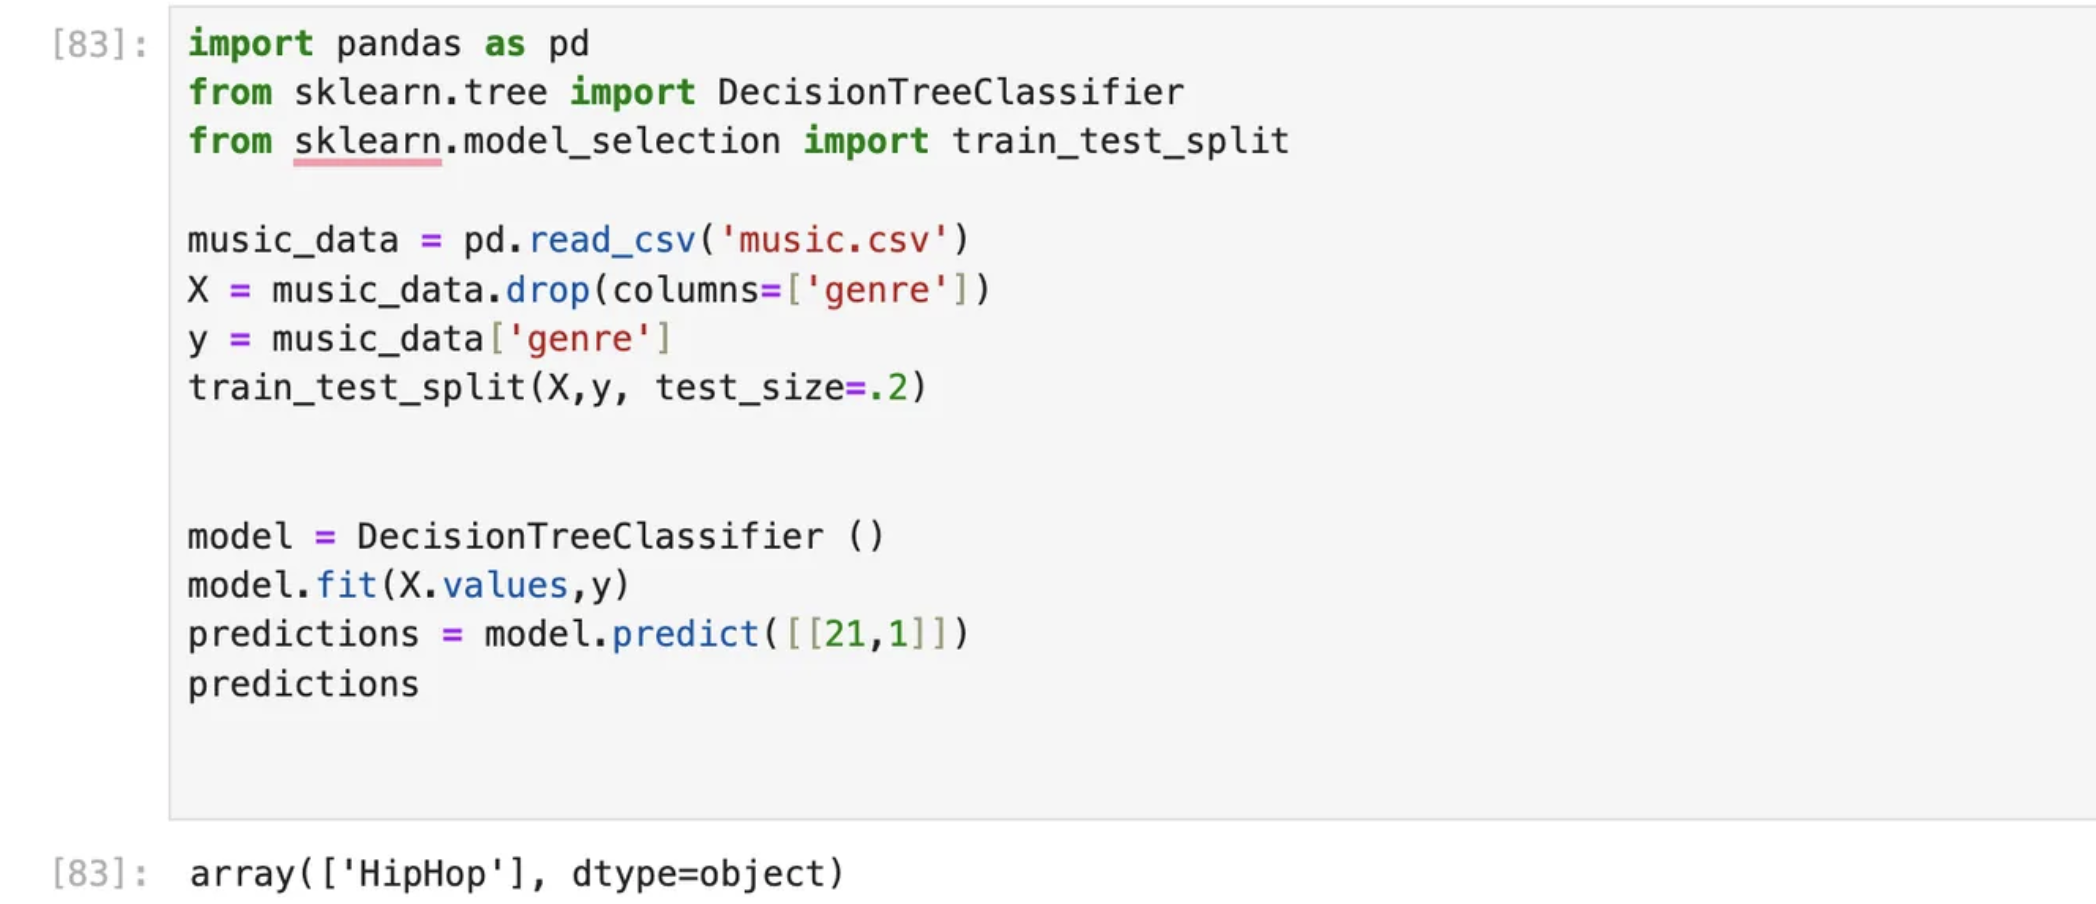
Good!
- Input = 32,
Expected Output: Classical
Actual Output: Classical
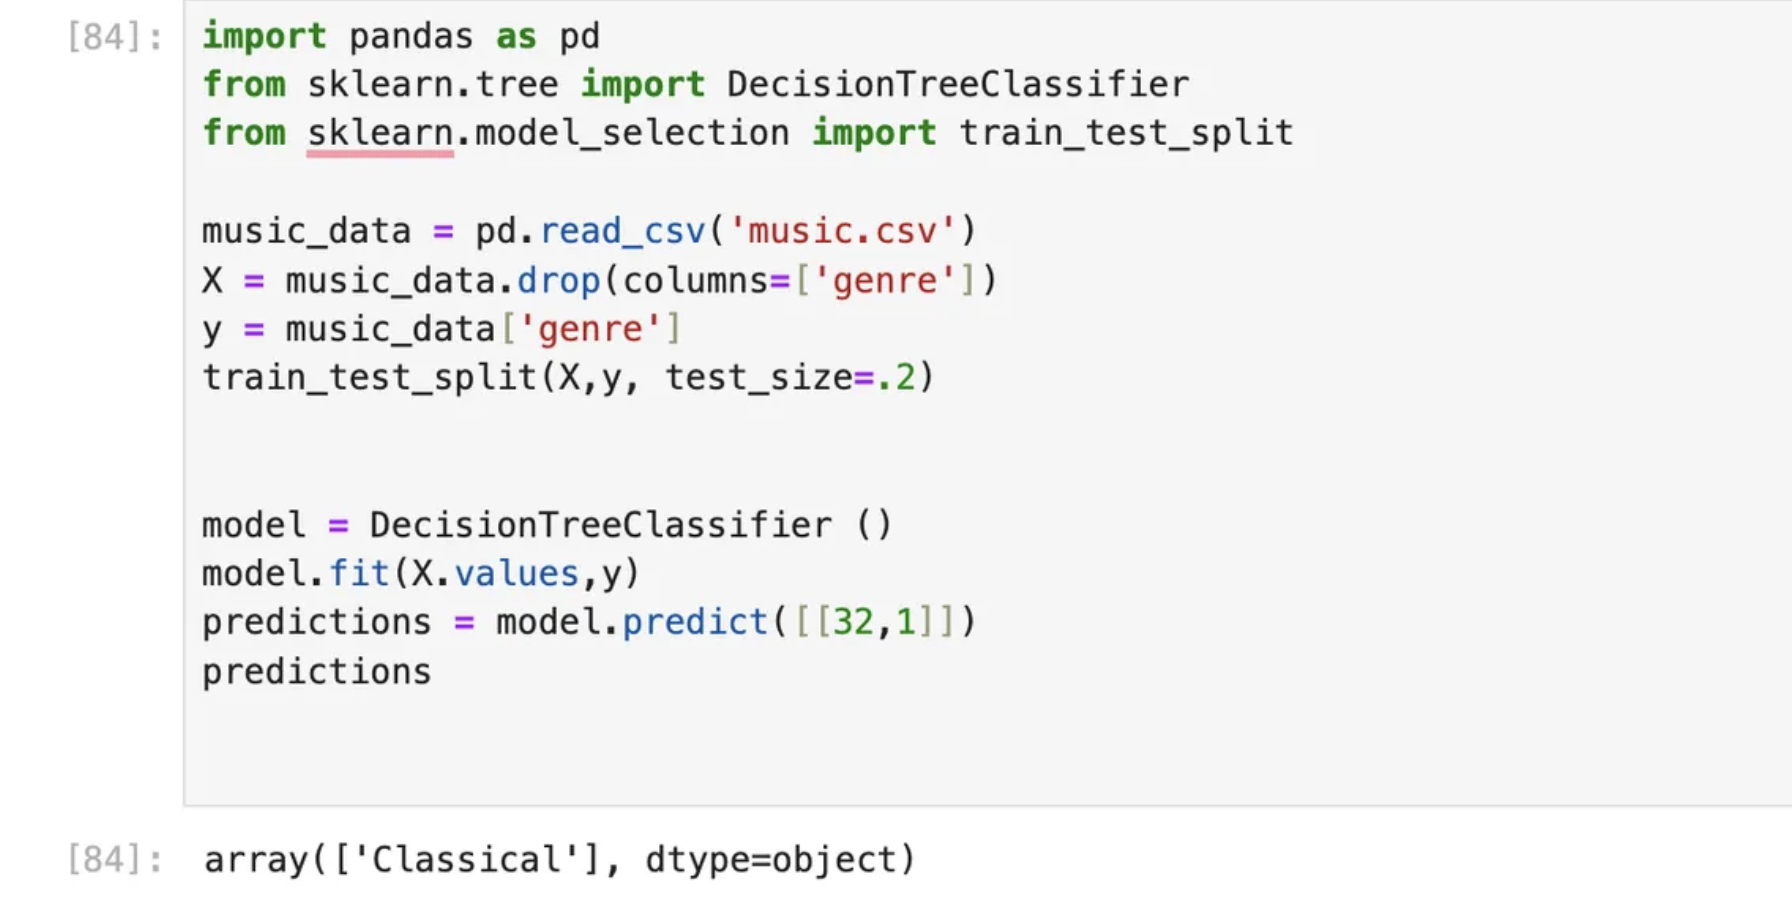
Good job! the predictions are accurate which is why model accuracy was 1 (100%)
If you change the number from training data less than 80% then accuracy will be impacted. So more the data to train the best result it will give.
Code bifurcation:
- Import necessary libraries:
pandas: Used for data manipulation and analysis.DecisionTreeClassifierfromsklearn.tree: This is a machine learning model that makes predictions based on decision trees.train_test_splitfromsklearn.model_selection: This function splits the dataset into training and testing subsets.accuracy_scorefromsklearn.metrics: This is used to calculate the accuracy of the model on the test set.Xis the feature set (all columns except thegenrecolumn).yis the target variable (thegenrecolumn, which we want to predict).X_trainandy_trainare the features and target variables for training.X_testandy_testare the features and target variables for testing.test_size=.2means 20% of the data will be used for testing, and 80% will be used for training.- This creates an instance of the
DecisionTreeClassifier. model.fit(X_train, y_train)trains the model using the training data (X_trainandy_train).
Displaying the accuracy score:
score
This will output the accuracy of the model on the test set.
Evaluating the model:
score = accuracy_score(y_test, predictions)
This calculates the accuracy of the model by comparing the actual target values (y_test) with the predicted values (predictions).
Making predictions:
predictions = model.predict(X_test)
The model makes predictions based on the test data (X_test).
Training the model:
model = DecisionTreeClassifier()
model.fit(X_train, y_train)
Splitting the data into training and testing sets:
X_train, X_test, y_train, y_test = train_test_split(X, y, test_size=.2)
This splits the data into training and testing subsets:Visualise testing and training data. 80% of data for train and 20% for test.
Separating features and target variable:
X = music_data.drop(columns=['genre'])
y = music_data['genre']
Loading data:
music_data = pd.read_csv('music.csv')
This line loads the music.csv dataset into a pandas DataFrame. This dataset is assumed to contain features (e.g., age, preferences) and a target column genre.
Bonus: if you would like to visualize how model is making predictions you can use run below code on jupyter and one file will be generated as music recommender.dot and you can run it on VS studio.
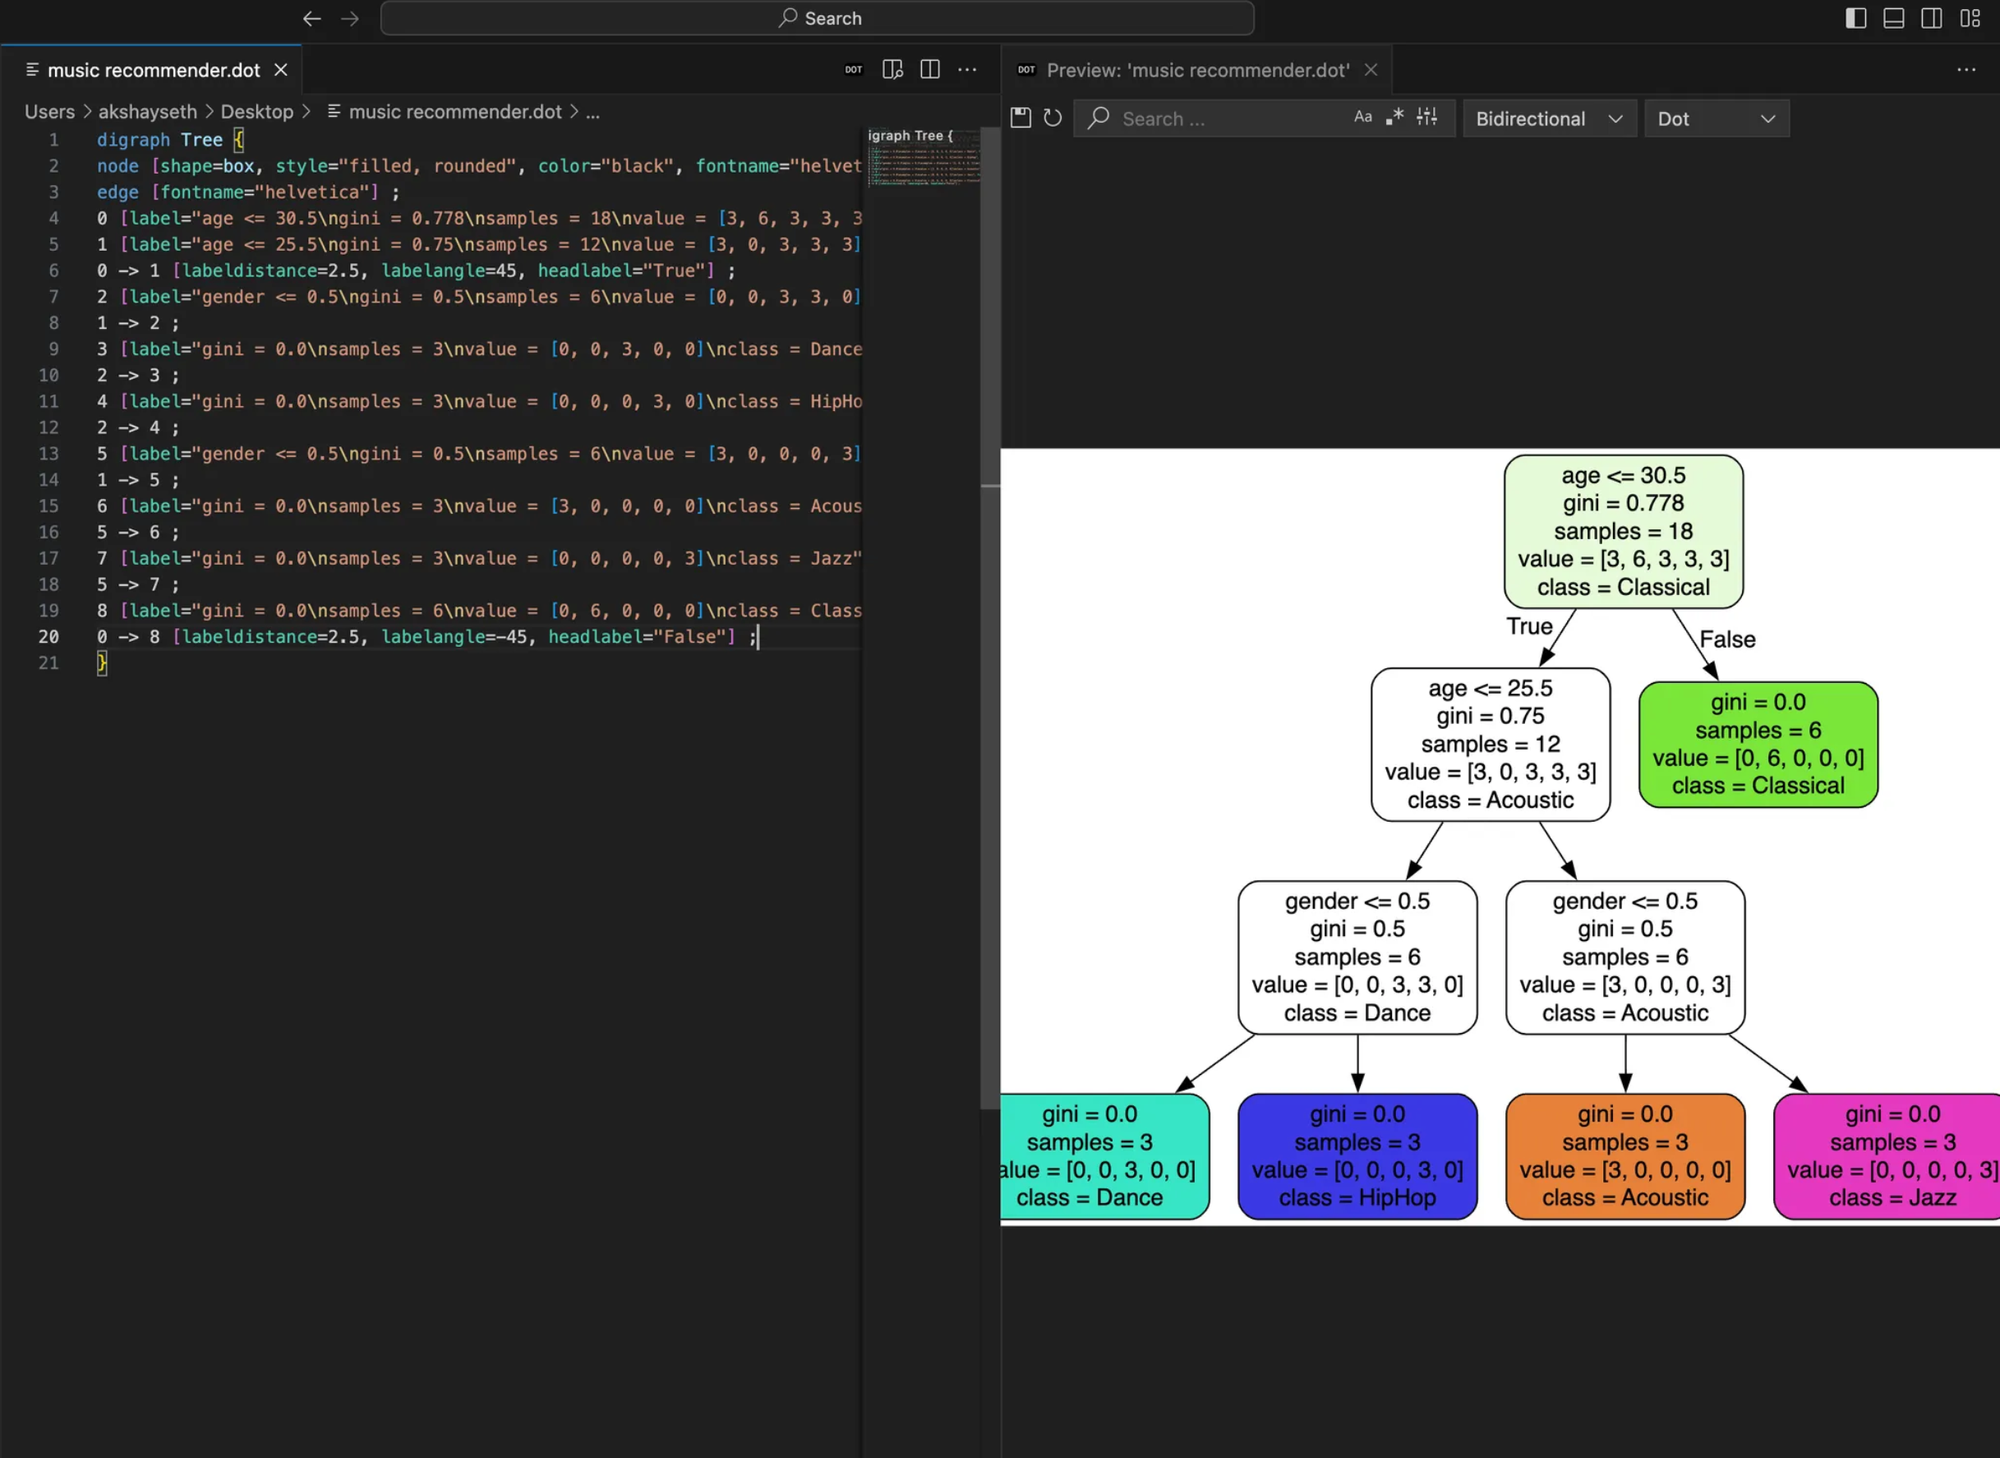
That’s it! Woohoo!
💬 Join the DecodeAI WhatsApp Channel for regular AI updates → Click here