[Day 18] Unsupervised Machine Learning Type 1 - K-Means Clustering (with a Small Python Project)
Ever grouped patients by symptoms or spotted fraud without labels? That’s K-Means! Dive into unsupervised learning with this visual Python project! 🧠📊
![[Day 18] Unsupervised Machine Learning Type 1 - K-Means Clustering (with a Small Python Project)](https://storage.ghost.io/c/55/e8/55e827ca-bf8d-4eee-bdb4-ee48e49a011a/content/images/size/w2000/2025/03/Gradient-Boosting-Machines-machine-learning-algo---visual-selection-1.svg)
Till now, we have explored Supervised Machine Learning, where models learn from labeled data but Now, let’s move into Unsupervised Learning, where the model finds patterns in data without labeled outputs.

🔍 What is Unsupervised Learning & Why Do We Need It?
Unsupervised learning is a type of machine learning where the model identifies patterns without explicit labels. Instead of telling the model what to predict, we let it explore and find relationships on its own.
💡 Why is it important in real life?
- Fraud Detection: Banks use it to identify unusual spending behavior that might indicate fraud.
- Medical Diagnosis: Doctors use it to find hidden disease patterns for early detection.
- Customer Segmentation: Businesses use it to categorize customers based on behavior for targeted marketing.
One of the most popular unsupervised learning algorithms is K-Means Clustering. Let’s understand it in the simplest way possible! 🚀
1.K-Means Clustering
🎯 What is K-Means Clustering?
K-Means is a clustering algorithm that automatically groups similar data points together based on their characteristics. The goal is to find K clusters in the dataset, where each cluster contains data points that are more similar to each other than to points in other clusters.
📌 Simple Example: Medical Diagnosis
Imagine a hospital wants to group patients based on their symptoms to detect diseases more effectively. They collect data on fever, blood pressure, and oxygen levels.
🔹 K-Means Clustering helps!
- It groups patients into clusters like Healthy, Mildly Sick, and Critical.
- Doctors can analyze these clusters to provide early treatment.
Refer velow videos for best explainations:
🛒 Real-World Use Cases of K-Means
1.Customer Segmentation (E-Commerce & Retail)
📌 Problem: A business wants to group customers based on their spending habits to provide better marketing offers.
🎯 K-Means Solution:
- Groups customers into clusters like Budget Buyers, Mid-range Buyers, and Premium Buyers.
- Helps businesses personalize marketing campaigns (e.g., offering discounts to budget buyers and premium experiences to high spenders).
2.Anomaly Detection in Banking (Fraud Detection)
📌 Problem: A bank wants to detect unusual transactions (potential fraud).
🎯 K-Means Solution:
- Most transactions fall into normal clusters, but outliers (unusual transactions) indicate possible fraud!
- Helps financial institutions like JP Morgan, Wells Fargo, and Capital One reduce fraudulent transactions.
3.Medical Imaging & Disease Clustering
📌 Problem: Hospitals need to group MRI scans to detect diseases early.
🎯 K-Means Solution:
- Groups similar MRI scans into clusters (e.g., healthy vs. potentially diseased regions).
- Used for detecting cancer, Alzheimer's, and heart diseases.
📊 How K-Means Works (Step by Step)
Step 1: Choose the Number of Clusters (K)
- Decide how many groups (K) to form.
- Example: If we want to divide patients into 3 groups, K=3.
[How we decicd the value of K, you can see in the video mentioned above]
Step 2: Assign Random Centroids
- Randomly place K points (centroids) in the data space.
- These act as starting positions for clusters.
Step 3: Assign Points to Nearest Centroid
- Each data point is assigned to the nearest centroid.
- This forms the initial clusters.
Step 4: Recalculate Centroids
- The centroid of each cluster is updated based on the average of all points in that cluster.
Step 5: Repeat Until Convergence
- Steps 3 & 4 repeat until clusters stabilize (i.e., centroids don’t change significantly).
🎯 Final Result: The data is divided into K meaningful clusters!
🖥 Python Mini Project: Patient Risk Level Classification
Let’s build a K-Means model to classify patient risk levels based on their medical records!
🔹 Dataset: patient_data.csv
Save this table as patient_data.csv
| Patient ID | Age | Blood Pressure | Oxygen Level |
|---|---|---|---|
| 1 | 45 | 130 | 95 |
| 2 | 50 | 140 | 88 |
| 3 | 60 | 160 | 80 |
| 4 | 35 | 120 | 98 |
| 5 | 55 | 145 | 85 |
| 6 | 42 | 135 | 92 |
| 7 | 30 | 110 | 99 |
| 8 | 65 | 170 | 78 |
| 9 | 48 | 138 | 90 |
| 10 | 58 | 155 | 83 |
| 11 | 33 | 118 | 97 |
| 12 | 52 | 150 | 87 |
| 13 | 40 | 132 | 94 |
| 14 | 67 | 175 | 75 |
| 15 | 38 | 125 | 96 |
| 16 | 47 | 136 | 91 |
| 17 | 29 | 108 | 100 |
| 18 | 62 | 165 | 79 |
| 19 | 57 | 152 | 86 |
| 20 | 44 | 128 | 93 |
| 21 | 59 | 158 | 82 |
| 22 | 32 | 115 | 98 |
| 23 | 49 | 140 | 89 |
| 24 | 63 | 168 | 77 |
| 25 | 46 | 134 | 94 |
📝 Python Code for K-Means Clustering (Patient Classification)
import pandas as pd
import matplotlib.pyplot as plt
from sklearn.cluster import KMeans
# Step 1: Load Dataset
data = pd.read_csv("patient_data.csv")
X = data[['Blood Pressure', 'Oxygen Level']]
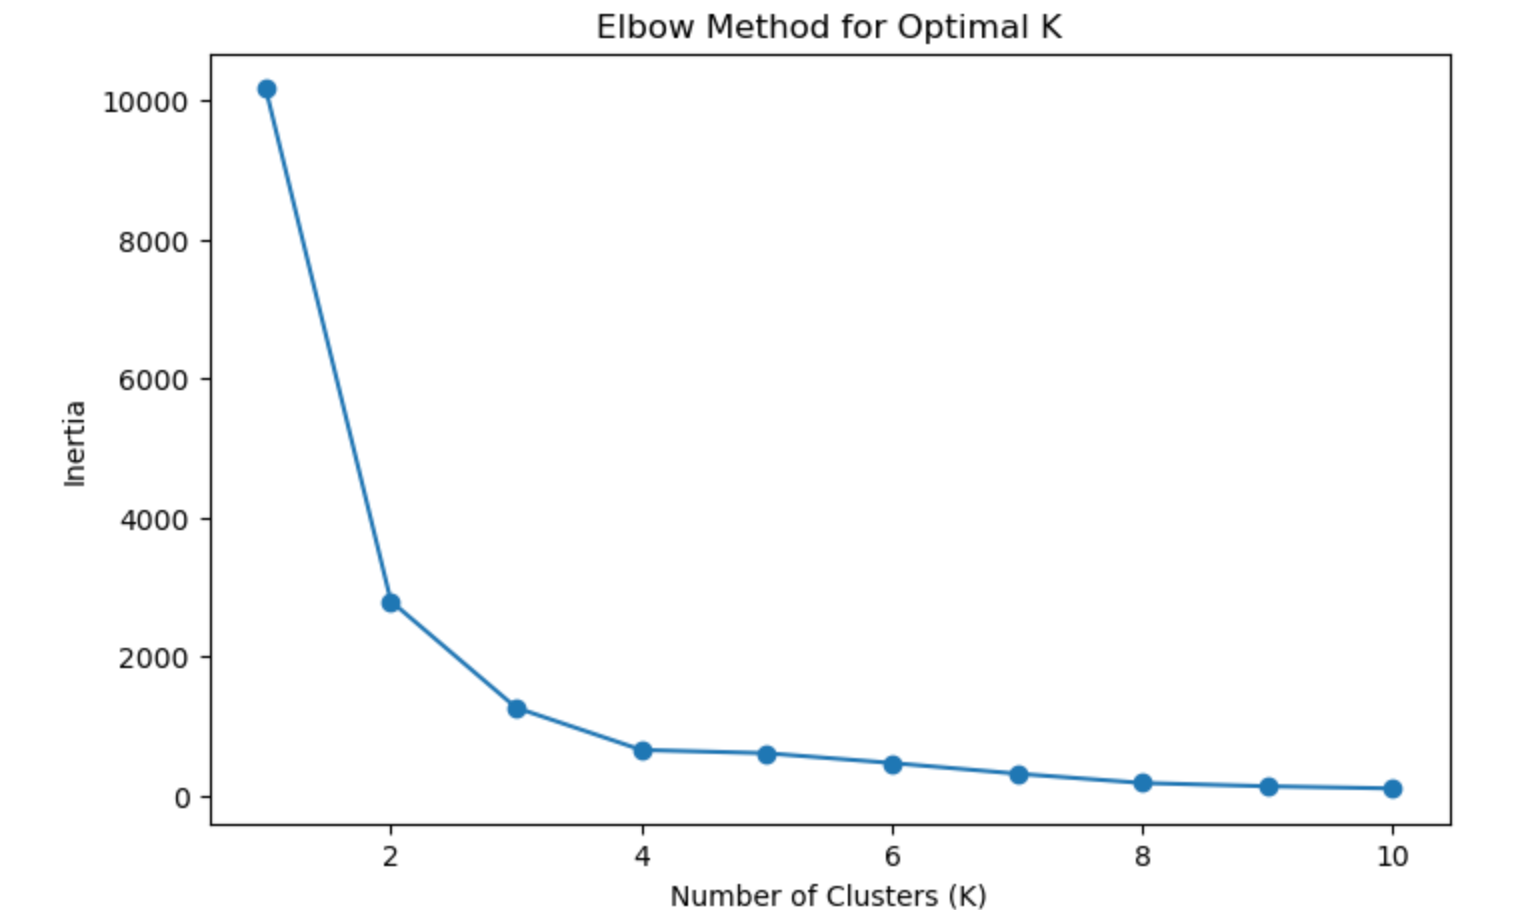
# Step 2: Find the Optimal Number of Clusters (Elbow Method)
inertia = []
k_values = range(1, 11)
for k in k_values:
kmeans = KMeans(n_clusters=k, random_state=42)
kmeans.fit(X)
inertia.append(kmeans.inertia_)
plt.figure(figsize=(8,5))
plt.plot(k_values, inertia, marker='o')
plt.xlabel('Number of Clusters (K)')
plt.ylabel('Inertia')
plt.title('Elbow Method for Optimal K')
plt.show()
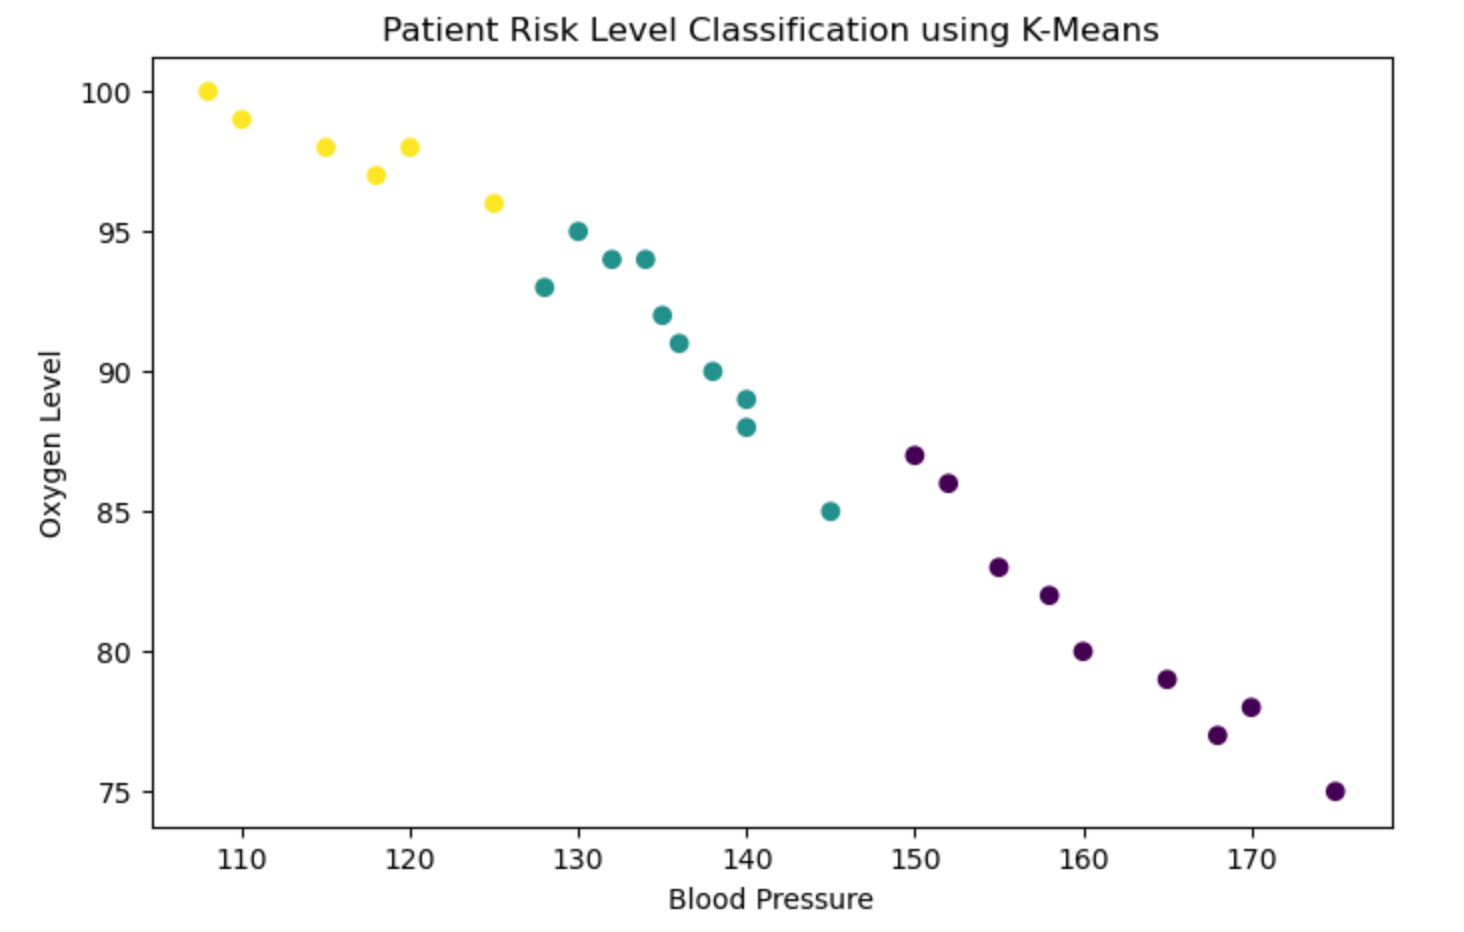
# Step 3: Apply K-Means with K=3
kmeans = KMeans(n_clusters=3, random_state=42)
data['Cluster'] = kmeans.fit_predict(X)
# Step 4: Visualize Clusters
plt.figure(figsize=(8,5))
plt.scatter(X.iloc[:, 0], X.iloc[:, 1], c=data['Cluster'], cmap='viridis')
plt.xlabel('Blood Pressure')
plt.ylabel('Oxygen Level')
plt.title('Patient Risk Level Classification using K-Means')
plt.show()
Result:
Elbow is made on k=3
Clustering:
Nutshell:
✅ K-Means helps in medical diagnosis, fraud detection, and customer segmentation.
✅ It automatically finds patterns in data without labeled outputs.
✅ It is widely used in banking, healthcare, and e-commerce.
💬 Join the DecodeAI WhatsApp Channel for regular AI updates → Click here